NBA MVP Regression Analysis Part 1:
Are Recent NBA MVP Selections Driven By Implacable Narratives?
Because of the aftermath of the most recent NBA Finals, analysts and voters may be more cautious of considering a player so substantially impactive that he deserves all first place MVP votes.
We all know that the first unanimous NBA MVP winner came last year with Stephen Curry taking home the honors. He was uniquely brilliant during the Golden State Warriors historic 73-9 regular season campaign but he left a little to be desired during his Finals appearance. Whether the reason for his shortcoming is injury or mental preparation or Cleveland’s defensive intensity, media members will be cognizant of Curry’s postseason when considering MVP unanimity in the future.
Throughout this series, I will pose a few questions, such as:
- What statistical categories are important to improve a player’s MVP consideration?
- Can narrative distort the MVP’s authenticity?
- What statistical production would be required to get another unanimous MVP?
- Is it possible for a traditional big man to gather all the first place votes in the modern NBA?
SteadyLosing MVP Model
It’s paramount that we first understand how a candidate acquires votes.
MVP Voting Procedure
For every MVP result, there is media staff who are given 1st through 5th place votes with corresponding integer values.
The most recent points system has been the following:
- 1st place vote – 10 points
- 2nd place vote – 7 points
- 3rd place vote – 5 points
- 4th place vote – 3 points
- 5th place vote – 1 point
Therefore, the total number of possible points that an MVP candidate can get is equal to # of voters x 10. A unanimous MVP gets a full share of the maximum amount of MVP points (share = 1).
Last year when Curry won, there were 131 media voters. 2015-16’s maximum MVP point tally was 1310 which he, of course, achieved.
Because the actual max point value for MVP changes during different years (as more members have voted in 2016 than in the past), I chose to use the share of maximum MVP points as the dependent variable for this model.
Independent Variables
To test how much the media’s decision is influenced by player statistical output and/or a prolific narrative throughout the season, I gathered independent variables from the last 10 MVP candidacy scenarios (dating back to 2006-07– Dirk’s year).
I wanted to find the statistically significant features, so I initially hypothesized a model involving the following categories:
- Team Wins (because MVP candidates are hardly taken seriously unless their teams finish within the top tiers of their conferences)
- Games Played (so that we prefer players who have been present in their contests)
- Double-Double average for the year (categorical variable: yes, no)
- FG%, 3P%, FT%
- 50-40-90 club representation (yes, no)
- *Points, Rebounds, Assists, Steals, Blocks
- Win Shares
I additionally took 2 important aspects into account:
- Different minutes allotments – I used the values per 36 minutes of the traditional categories for every player who got an MVP vote in the past 10 years.
- Different years, different scoring leaders – I organized the per 36 data such that the MVP candidates get a value from 0 to 1 to signify how much they fill that category relative to its per 36 leader. Curry led the league in scoring last year and therefore received a 1 in that category.
Of course, these are not the only factors that I could’ve included. If a player’s team is 1st in offensive efficiency, then that could go a long way toward solidifying more votes. It may have been more feasible to provide more sabermetrics with fewer observations of more recent years.
Final NBA MVP Model
After I regressed factors several times, I ended with this model:

It’s not easy to explain all the variability that comes with human voting. The eye test, injuries, etc. will make the outcomes even more convoluted at times.
For instance, where are rebounds in this model? The model contends that rebounding prowess simply hasn’t been crucial to deciding the voting share an MVP candidate accrues.
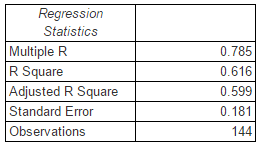
The R^2 is okay at 61%; there exists some multicollinearity because of the nature of related factors like scoring, win shares, and WS.
All things considered, MVP selection is a tricky process, and our model correlates well (.785 = positively correlated) with what goes on during the postseason decision. These positives give us confidence in the explanatory power of this model.
Understanding the results
Given our coefficients, we have results for each candidate over the past 10 years that we’ll call the Predicted Share of maximum MVP points.
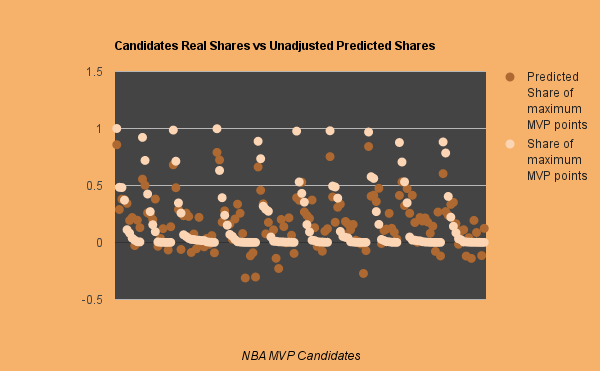
We can map the predicted value against the actual value of all 144 former candidates during the selection process; it correlates remarkably well.
Analyzing a Unanimous MVP with the MVP Model: 2015-16 Results

The MVP Model suggests that Stephen Curry fulfilled the criteria to EASILY win the MVP this past season– he’s four tenths clear of the competition!
However, we will still need to make adjustments to normalize our data, because…
- In the 2015-16 season, Damian Lillard’s per game numbers were 25.1/4/6.8, but the model says that he should have gotten negative consideration for the MVP race. Because it’s impossible to score negative MVP points, so we must change this share value to 0 by default.
- Also, the predicted share (of max MVP points)’s total sum for the 2015-16 candidacy is greater than the actual sum of real shares (of maximum MVP points) which cannot happen. The sum of the actual share of max MVP points is 2.601, and it must be this way to account for the 131 voters, each with 5 choices. So, we also scale the unadjusted values with a reorganizing ratio to meet this mark.
True Adjusted Value
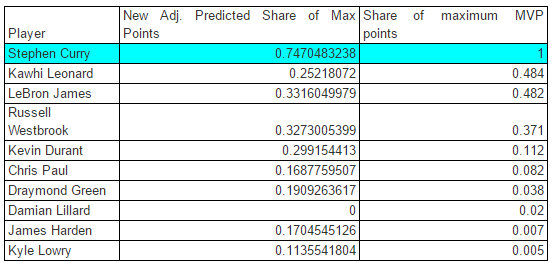
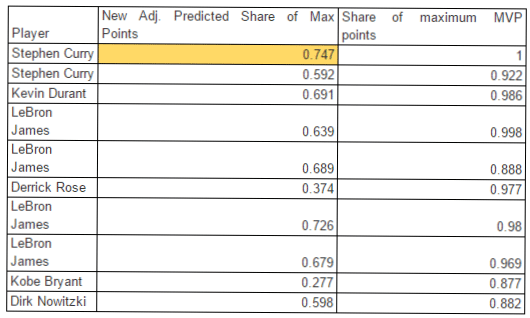
The results are wonderful in this instance. Curry gathered .42 more of the maximum available points than any other competitor last year, so the model would suggest that his unanimous MVP was warranted.
In fact, his mark was greater than any other member of the adjusted model over the past 10 years.
Take a look:
Nevertheless, there are two peculiar disagreements– that could incite turbulence between sectors of the NBA community with strong allegiances– among the 10 results.
NBA MVP Year-by-Year Comparisons: Congruence Scores
The congruence score comes from the correlation value between the Predicted Share of Maximum MVP Points and the real Share of Maximum MVP Points.
The score can range from -1 to 1; and as the score increases from 0 to 1, the model more precisely aligns with the real-life decision-making.
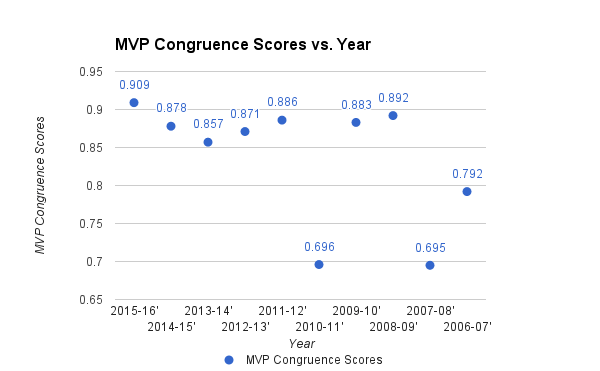
- Any value between over .85 signifies a strongly positive correlation and an agreement between the prediction and the human appointment. This is what we prefer!
- Between .7 and .85 should give us a little pause because it suggests that the MVP choice wasn’t the most clear-cut decision. This occurred during Dirk’s year when he, unfortunately, received his award after a 4-2 opening round loss to the Golden State Warriors.
Any number below .7 generally alarms us that:
- the model may simply be short-sighted (which could be true as it doesn’t have a visual representation of season-long dominance)
- or, the voters could assign the MVP with emphasis on a player’s eye test/previous legacy/ability to defy preseason expectations.
We’ve discussed the case in which Stephen Curry won the MVP unanimously and the SteadyLosing MVP model helped substantiate the decision, but now let’s examine a case where the model deviates from the true selection.
Should Derrick Rose have won the 2011 NBA MVP award?
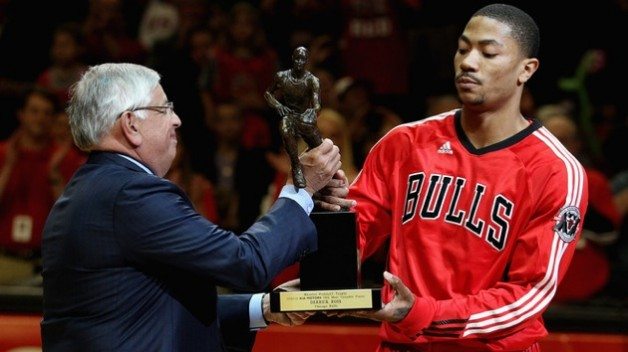
2010-11 Congruence Score =.696
This is our first cause for concern about disagreement. According to the votes, in May 2011, Derrick Rose received 1182 points out of 1210 (share = .977); Dwight Howard was 2nd with 643 points, and then LeBron James had 522 total points. Rose got 113 of the 121 first-place votes.
How could it be that our SteadyLosing model weakly correlates with this real-life response?
Let’s consider both the per 36 stats and the model’s independent variables to discuss whether this dissenting opinion has substance.
Here were the per 36 season stats of each player:
Rose: 24.1/3.9/7.4/1 steal/.6 blocks — .445 FG%/.332 3P%/.858 FT%
Howard: 21.9/13.5/1.3/1.3/2.3 —– .593/0/.596
James: 27.4/6.7/7.9/1.5/0.9 —- .51/.33/.759
Here’s how each candidate fulfilled the independent variables of the SteadyLosing MVP model. Because of the inequality in variable importance, the model strongly favors players with higher Win Shares and points per 36 minutes.

And additionally, a heatmap to visualize how impressive the candidates were in order with which they placed in the voting results. (All rankings provided by Basketball Reference.)
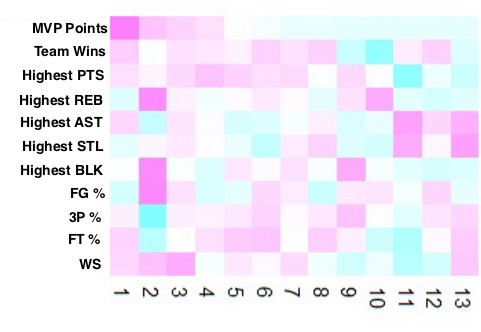
(Heatmap for various categories in 2010-11 MVP Candidacy; red = impressive, blue = relatively unimpressive. Candidates 1-13: D. Rose, D. Howard, L. James, K. Bryant, K. Durant, D. Nowitzki, D. Wade, M. Ginobili, A. Stoudemire, B. Griffin, R. Rondo, T. Parker, C. Paul)
LeBron James is without a single blue (cold) spot in the diagram.
With these stats accounted for, we can begin to make a rebuttal to insist that, although Rose’s team was the number 1 seed, he may not have been the optimal selection.
From the analysis, we get these raw predicted values for the MVP share:
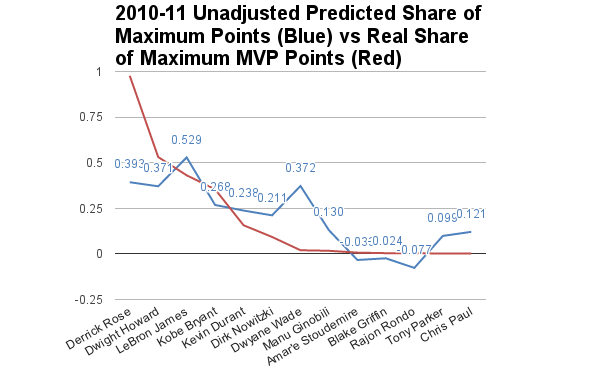
Then, after turning the negative share values to zeroes and using the reorganizing ratio to equate the sum of the predictive share values with the sum of the real share values, we achieved this graph:
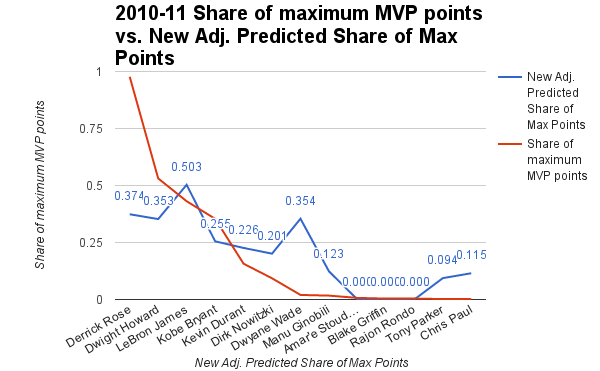
According to this model, LeBron James should have won the MVP during the 2010-11 season with an approximate (and adjusted) predicted share of maximum MVP points of .503, or 608 votes!
And unless one’s argument is fueled by the notion that Rose trumped James in the eye test, it would be difficult to propose that LeBron James was completely undeserving of the most MVP votes during the 2010-11 season.
If the suggestion that the SteadyLosing model proposes are permissible, then we can use it for insight on how a future candidate would score and what he would need to be the second unanimous MVP.
Can Russell Westbrook or James Harden perform well enough to become the second unanimous NBA MVP? More to discuss in part 2.

