Stephen Curry taking home the 2016 NBA MVP award in unanimous fashion got many people wondering. Why was he the first and will there be another unanimous NBA MVP? It’s hard to tell just by guessing but some statistical analysis could give some insight into what is to come. If you want the insight on the SteadyLosing model that I will use to answer this question, then you ought to check out Part 1. Last time while discussing the NBA MVP voting process from an analytical stance, I uncovered how the model produces its predicted share of maximum MVP points.
This time, we’ll take an even closer look at statistical factors that greatly affect the yearly voting process and then predict the unadjusted share of max MVP points of a hypothetical, prospective unanimous NBA MVP candidate.
Regression Tree Analysis of SteadyLosing NBA MVP Model
This is a visualization technique that will give us more insight on the SteadyLosing NBA MVP model and the criteria that media voters have taken into account. A regression tree will predict the responses for a data table, given how an entry fulfills the independent variables in the model. It continues to split response data based on whether the entry has a value that is greater than (or less than) a generated value [or, 0 or 1, if the independent variable is a binary value]. The branches stop once the analysis realizes that we cannot receive any more useful data from further iterations, also known as a stopping criterion.
I used R to code the regression tree and generate the resulting output. I’ll append the code used to perform this measures at the end.
In our SteadyLosing MVP regression model, we have Predicted Share of Maximum MVP Points as a dependent variable, many continuous predictors (FT%, Win Shares, etc.) and a categorical variable (50-40-90 club).
Here’s the schematic:
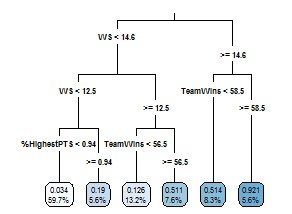
Here’s how to interpret the schematic:
- There are 144 initial observations before any splits.
- The first set of tree branches divides the database based on whether the player’s Win Shares are over/under the threshold of 14.6.
- Because Stephen Curry had 17.87 Win Shares in 2015-16, he would separate toward the right of the diagram along with 19 other members.
- Any player who doesn’t meet this requirement can likely only reach a maximum of .511 share of the max MVP points.
- If any player accounts for fewer than 14.6 Win Shares, then he will then have to pass through the next branch which is 12.5 Win Shares.
- Draymond Green had 11.1 Win Shares this past season; therefore, he will move to the left of this individual branch with 94 others.
- Otherwise, he’ll proceed to the right of the branch to the next iteration.
And so on…
Then, to show with which type of leaf (or, terminal node) each MVP candidate aligns:
- Player 1, who has fewer than 12.5 Win Shares (WS) and scores lower than .94 of the per-36 scoring leader, is predicted to have a share of max MVP points of .034 (in 2016, an equivalent of 45 points out of 1310).
- 59.7% of NBA MVP candidates over the past 10 seasons fall under this category– example: Damian Lillard in 2015-16
- Player 2 has fewer than 12.5 Win Shares but is near the top of the NBA in scoring. He is predicted to gain about .19 of the potential MVP points (249 points in 2016). To achieve such a value, you really must score at an elite level.
- 5.6% of NBA MVP candidates fall into this category– example: Kobe Bryant in 2012-13
- Player 3 has greater than 12.5 WS, fewer than 14.6 WS, and is on a team with fewer than 56.5 wins. He is projected to win around .126 of the maximum MVP points (165 points in 2016).
- 13.2% of NBA MVP candidates fall into this category– example: Wade in 2009-10
- Player 4 has greater than 12.5 WS, fewer than 14.6 WS, and is on a team with greater than 56.5 wins. He is projected to win around .511(!) of the maximum share of MVP voting points.
- 7.6% of NBA MVP candidates fall into this category– example: Bryant in 2008-09
- Player 5 has more than 14.6 WS but is on a team with fewer than 58.5 wins. He is projected to win .514 of the maximum MVP share. NBA pundits generally insist that a true NBA MVP candidate must be within the top three seeds. This result would support that voting results are true to that notion.
- 8.3% of NBA MVP candidates fall into this category– LeBron James in 2013-14
- Player 6 has more than 14.6 WS and has greater than 58.5 team wins. He is projected to win .921 of the maximum MVP share. This type of candidate will almost certainly win and may even approach unanimity.
- 5.6% of NBA MVP candidates gain such a share of the MVP voting.
The mean absolute error (MAE) between the regression tree’s predicted share and the real share is about 8.8% which is a little high but understandable given our congruence scores in Part 1.
Additionally, as part of the analysis, we were given a table that measures the importance that each variable has for the model’s regression– closer to 100 signifies greater explanatory power:
| Win Shares | Team Wins | %HighestPTS | FT% | 50-40-90 club | %HighestAST |
|---|---|---|---|---|---|
| 63 | 16 | 9 | 5 | 5 | 2 |
Therefore, as we’ve expected, the result of the Win Shares formula has the greatest influence on the terminal nodes and expected share values.
Side note:
As a refresher, we should revisit the idea of Win Shares because it is so significant and representative of the voting process. Although convoluted, Basketball Reference portends that Win Shares consists of a pace-adjusted version of a complex summation of points produced and defensive rating. Therefore, producing offense at a level that is far above league average would yield a high value of Offensive Win Shares in the formula; contributing to a defense that plays far above league average would yield many Defensive Win Shares. Total Win Shares would be the sum of both Offensive and Defensive Win Shares. An oversimplified way of explaining this: Individual brilliance while embracing a team concept provides high win share totals.
The second most important variable is team wins. For the elite players with high Win Shares, Team Wins and Win Shares will likely move (upward/downward) in tandem and have a high covariance (multicollinearity).
Therefore, next step in refining this process would be to provide ridge regression to ascertain if our independent variables and their respective coefficients are stable. By applying a value (lambda) in the model’s variance-covariance matrix, we can limit the effects of multicollinearity on our model.
What type of statistical output would give us a sound chance of producing another unanimous NBA MVP?
Of course, we need to hypothesize given the model’s coefficients.
| Variable Name | Independent Var. | Coefficients |
| Intercept | -0.9581 | |
| A | Team Wins | 0.0088 |
| B | %Highest PTS | 0.6252 |
| C | %Highest AST | 0.1698 |
| D | FT% | -0.5340 |
| E | 50-40-90 club? | 0.1102 |
| F | WS | 0.0458 |
To calculate Predicted Share of Maximum MVP Points, the equation would be:
Predicted Share = -.9581 + .0088A + .6252B + .1698C -.5340D + .1102E + .0458F
How can we maximize the predicted share of max MVP points given a series of constraints?
During my discovery, it was actually very difficult to produce a remotely feasible season worthy of a predicted share of about 1 (which would be undoubtedly unanimous). To do so, I included the maximum statistical production in each category since the 1995-96 season.
Using the Solver tool, I attempted to optimize the predicted share value given the aforementioned constraints.
| Predicted Share | Team Wins | %Pts relative to leader | %Ast rel. to leader | FT% | 50/40/90 Club | Win Shares |
| 1.002 | 73 | 1 | 1 | 0.98 | 1 | 20.43 |
To be a player who is the leader of a 73-9 team, leads the league in points per 36, assists per 36 and free throw percentage, shares a spot in the 50-40-club and accounts for 20.43 Win Shares (MJ’s 95-96 mark) is relatively impossible.
Therefore, considering that even the unanimous MVP Steph Curry did not achieve an unadjusted share value of 1 in the SteadyLosing MVP model, it’s more reasonable to expect a new, potential unanimous choice to have a predicted share value that is comparable to Steph’s raw unadjusted share of max MVP points (.857).
My point is to insist that if the new unadjusted predicted share of max MVP points exceeds Curry’s score, then he is highly likely to win every first-place vote in the NBA MVP ballot.
Here are a few examples of what might give a player consideration:
| Predicted Share | Team Wins | %Pts relative to leader | %Ast rel. to leader | FT% | 50/40/90 Club | Win Shares |
| A — 0.864 | 64 | 1 | 1 | 0.9 | 1 | 18 |
| B — 0.861 | 70 | 1 | 0.2 | 0.7 | 0 | 20 |
| C — 0.852 | 50 | 1 | 1 | 0.9 | 1 | 20.43 |
Proposition #1: Ultra-efficient ball-dominant guard with elite team record (most feasible of the three)
In the first, Player A has exceeded the share value mark that Curry amassed via the SteadyLosing model. Player A’s team would most likely be within the first 3 seeds in either conference if his team reached a 64-18 record. He would have led the league in points per 36, assists per 36 and would be a member of the 50-40-90 club as well. In addition, he would be accountable for 18 Win Shares.
While Player A’s feat would be very difficult to achieve and there have only been 36 seasons in NBA/ABA History with players who surpassed 18 Win Shares, it isn’t completely unattainable and would probably warrant unanimous MVP consideration, regardless of the strength of A’s competition (before adjusting share values).
To restate A’s mirific production in terms of the 2016-17 season, A would have:
- 64-18 record
- 32.6 points per 36 (or greater, to maintain the value of 1 in %pts relative to leader)
- 11.7 assists per 36 (or greater)
- 90% FT
- 50-40-90 club member
- 18 Win Shares
It’s essentially imperative that the player leads the league (or sits near the top) in scoring per 36. For every ten percentage points fewer than the league leader in scoring per 36, the player loses .062 from his potential predicted share value. Additionally, being a member of the 50-40-90 club would enhance his positioning more than a tenth of a point.
Proposition #2: Dominant non-facilitating big man PF/C
This one would certainly be tough to achieve. No one has gotten over 20 Win Shares with any regularity. For as dominant as Stephen Curry was in the 2015-16 NBA season, he accounted for 17.87 shares. LeBron James once averaged 20.3 Win Shares in 2008-09, but he was 28/7/7 with an eFG% of .53.
Simply imagine the net rating that he would have to maintain to account for these win shares. For reference, Curry was +22.2 On/Off in 2015-16, and James was +21.2 On/Off in 2008-09.
Frankly, it may not be realistic to expect any traditional, inside-scoring big man to fulfill the requirements necessary to be soundly unanimous in accordance with this model (lest he facilitates and records more assists per 36 minutes). To clarify, if this big man, Player B, were to have a great opportunity of winning the NBA MVP alone, he would need:
- 70-12 record
- 32.6 points per 36 (or greater)
- 2.3 assists per 36
- 70% FT
- 20 Win Shares
As a reminder, the only player to average more than 32/2 assists per 36, to shoot >70% from the foul line, and to amass more than 20 Win Shares is Michael Jordan. Player B would have to spearhead a legendarily potent offense in increase his chances of approaching 20 Win Shares. If B could approach these totals, then he fully deserves all accolades.
Proposition #3: Ultra-efficient Playmaking Guard w/ 50 Win Maximum
In most years in the Western conference, it’s difficult to get home court advantage with fewer than 50 wins.
Let’s assume that an NBA MVP caliber point guard is, at least, average from the free throw line (as of 16-17, 76.6%) for reasonableness (otherwise, given the formula we could maximize Player C’s chance of winning a unanimous MVP by decreasing his FT% to 0%). If we optimize his predicted share thereafter, then the maximum value is .852 (beneath that of 2015-16 Stephen Curry). And considering that Stephen is the only unanimous MVP ever, we would have reason to be agnostic about whether C’s unadjusted value will make C a unanimous MVP.
In this scenario, the likelihood that Player C be considered as a unanimous MVP decreases– which is sensible, as unless a player’s team is within the top 3-4 seeds of the conference, the voters conventionally don’t consider him a legitimate threat to win the MVP.
Conclusion:
Because our model often correlates with the real-life NBA MVP voting outcome, it is possible that we appoint another unanimous candidate– but probably not going to happen with the stiff competition this season.
Now, it may be easier to achieve unanimity in a different year… The %Highest Points & %Highest Assists categories could be less demanding if the league’s competition has fewer dynamic individuals.
Additionally, let’s be clear that there is a possibility that a player with a lower predicted unadjusted share of max MVP points than that of 2015-16 Stephen Curry becomes an unrivaled MVP. However, since unanimous NBA MVPs aren’t handed out generously, we shouldn’t expect the committee to lighten up.
Other notes:
I tried to use constraints for my hypothetical players that were reasonable. I recognize that the coefficients of the SteadyLosing model are regressed such that FT% of 0 would be over .3 share points better than FT% of .7. However, deplorable Free Throw percentages are relatively uncommon among recent MVP candidates and prospective scoring leaders. Once again if I were to perform ridge regression, I could test for the stability of these coefficients. The goal is always to improve the explanatory potential of this model.
*Regression Tree exposition here
*R Code and Produced Results here