Shout-out to @KJ_NBA because his suggestion on Twitter prompted this thought process.
“How many wins would LeBron add to league’s worst team?”
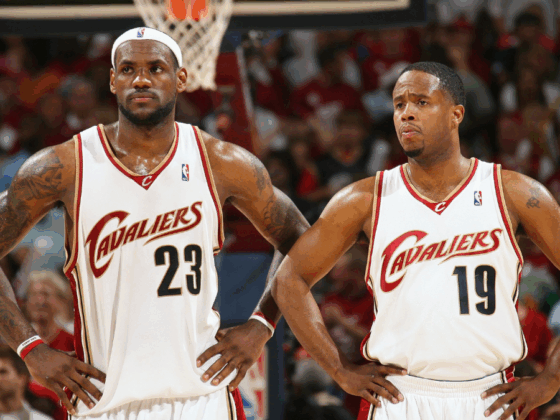
Can we attempt to quantify LeBron James’s win-loss impact on a bad team, like the Brooklyn Nets?!
For some entertainment, let’s allow LeBron James to play for the worst team in the NBA. The Brooklyn Nets aren’t unequivocally the worst team in the league right now. However, they are devoid of talent and assets, so we’ll use them.
From the various responses I saw, the consensus was that LeBron James could add from 15-20 wins to the worst team in the league.
I don’t aim to impose my assessment as the upper limit of possible wins for a LeBron-led team. Maybe, LeBron James goes 60-6 with the 2012 Charlotte Bobcats.
In this post, I’m going to do the following:
- Refer to some well-known ways that we quantify individual effect on win-loss records
- Introduce an alternative regression model to assess win capability
- Compute Brooklyn’s W-L, given the model
- Adjust the input on the model to account for a Lebron-led Nets team (and qualify the adjustments)
- Calculate Lebron’s Nets W-L, given the model, and the difference between both teams
How can we track LeBron James’s impact on Win-Loss records with advanced stats?
We can take a few looks at his On/Off Net Rating to make a solid estimate of his game-by-game impact (stats via Basketball Reference). From there, you could try to infer how this could translate to a number of extra wins he would provide his team would get over an 82 game season.
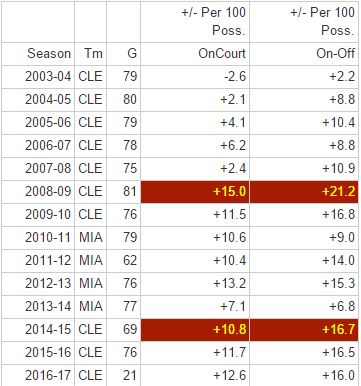
When Lebron isn’t on the court, his team will regularly struggle, but on/off alone is hard to assign a number of wins based on the data above.
Or, we can take a peek at his impressive win shares, initially used for evaluating individual impact in baseball, over the years and extrapolate, saying that a Lebron-led team gains X games in the season to any team.
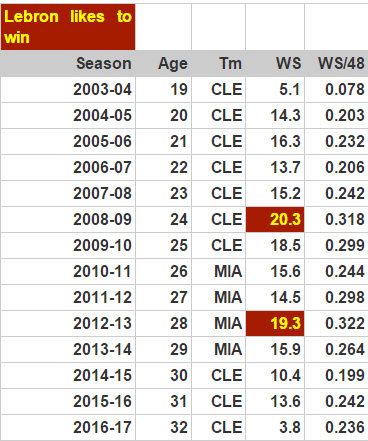
‘Win Shares’ contends that peak Lebron could add 20 more wins to his team. I also highlighted 2012-13 when LeBron James played 82% of his minutes as a PF and held a marvelous 64% TS% during the most efficient season of his career.
The formula for Win Shares is appropriately complicated. However, no player can have negative win shares by this formula. Evan Turner has .5 win shares in Portland so far in 2016-17 and .036 WS/48 minutes.
Trying to go deeper
Ideally, we’d like to have a metric that can further differentiate between the impact that Lebron James brings to a hypothetical team X and the impact that Evan Turner would bring to the same team X.
And we want to be more savage! Box Plus-Minus suggests that this year’s Evan Turner has a BPM of -3 (as of 12/12) and a Value Over Replacement of -.2. The negative values indicate that because he’s been paid generously, his production has been disastrous. Disaster! Awesome!
This way, we can be more confident when discussing the extent to which someone is vital to team success.
Linear Regression Model for NBA Win %
So, I wanted to propose a different measure to answer this question. I began by proposing that there are quantifiable independent variables that describe NBA principles that lead to success/failure in the modern NBA. For example, we can assess how well a team can:
- Protect the rim
- Execute their offense to find shots with higher expected return (i.e., short corner 3s, layups/dunks)
- Force opponents to take contested, long mid-range shots, which are of low expected return
- Have All-Star caliber players that demand extra defensive/offensive attentiveness from the players and the coach’s gameplan (categorical variable, b/c you either have them on your roster or you don’t)
- Shoot lethally from 3 point range
- Do not often surrender 3 point barrages because of disruptive wing defenders
- Win turnover margins with regularity
So with that in mind, before the season, I chose several categories from the past 2 seasons (60 total teams, 60 observations). I regressed around 16 factors, but some didn’t make the final cut.
Final Model with Corresponding Coefficients
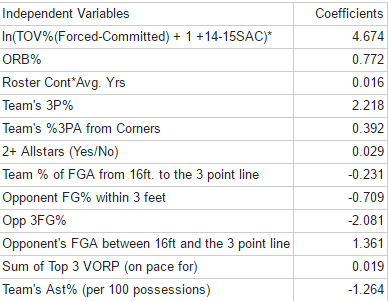
- Coefficients are made with a 95% confidence interval
- The R-squared value was 92.3%.
- A large portion of the stats are from Basketball Reference; others are from NBA.com.
- I initially compounded Roster Continuity & Avg Years of Experience (of players who played over 18 MPG) experimentally
- *In 14-15 Sacramento had a -3.0% differential in turnovers forced – turnovers committed. I took the natural logarithm to avoid a standard deviation that was larger than the mean of the variable.
It’s also worth noting that these are the results I got from this particular model are not absolutes, and if I were to have chosen different variables, then I might have had a unique result. Additionally, although the result for Team Assists% is not exactly intuitive (as it is literally saying that for every added % to a team’s assist ratio, the winning percentage decreases 1.26%), the result was statistically significant and therefore important to the accuracy of the results.
Why it’s plausible to believe this model and use– with percentages from last year
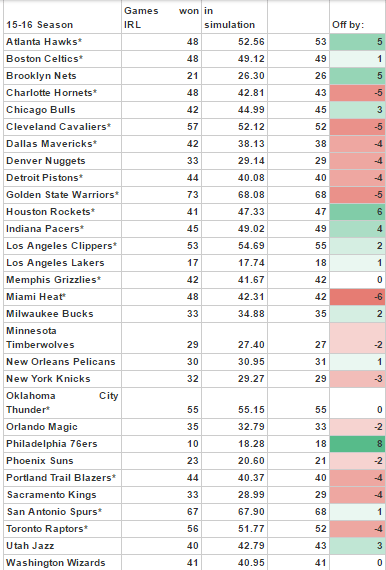
We have good reason to feel confident while using this as a simulation of winning percentage because of the accuracy of its simulated win totals. Of course, there are outliers and teams that will win/lose in spite of how poorly/well they achieve their criteria that I presupposed earlier.
The average discrepancy between the real win total and the simulation win total was 3.03.
The maximum by which the simulation was off was 9. It underestimated the 14-15 Boston Celtics, pegging them at 31 wins rather than the 40 that they actually accrued over the season.
Here are all the results from the 15-16 Season — used as further justification for the model’s reliability:
2016-17 Brooklyn Nets outlook w/ reference to this regression
The Nets’ tendencies as of 12/13 are a product of the coach’s design, player tendencies and defensive dictation. And additionally, their efficiency is a product of the individual player’s capability and other factors that are subject to change (based on defensive pressure, team’s lineup and personnel choices).
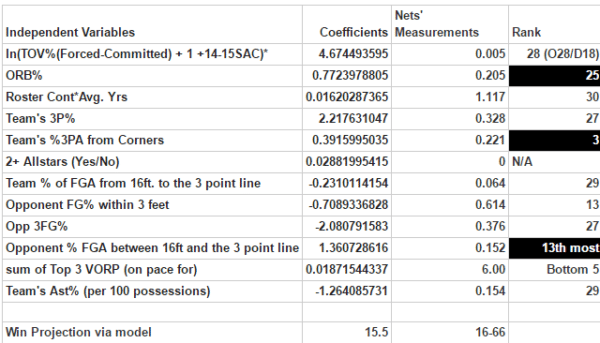
According to the model, the Brooklyn Nets would be on pace to win 16 games all season. Given the makeup of their current roster, it actually seems as if it would be a reasonable prediction. The fact that they’ve been 6-17 through the first two months means that we should credit Kenny Atkinson and his resilient group.
LeBron’s effects on the independent variables
I would argue that the three coefficients that I highlighted in black will remain stagnant despite LeBron’s presence. For the remaining independent variables, I’ll propose a new value to implement into the model and attempt to justify the choice. From there, we can produce a LeBron-adjusted value, subtract it from the Nets’ current extrapolation (16-66), and find out if our answer is congruent with our 20-game addition hypothesis.
For the unmarked variables, it is likely that the addition of LeBron would distort the Nets’ 12/13 measurements to some degree.
ln(Turnover Margin) = 0.0198
Because LeBron is a uniquely gifted, superbly accurate passer, the Nets will probably see the percentage of possessions ending in a turnover decrease significantly. At the moment, the Nets are -2.5% in the turnover diff. per 100 possessions. Let’s take a look at recent Lebron-led teams and the current Nets:
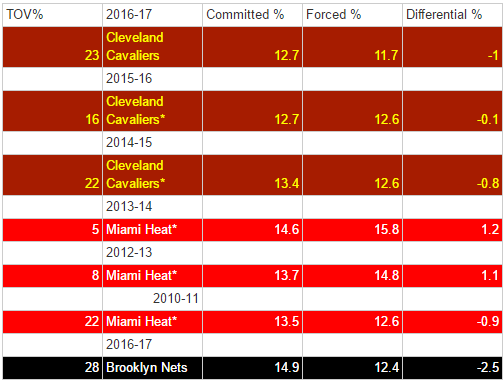
While the Nets struggle to control the ball, LeBron James would provide significantly greater efficiency in their offense. It’s unclear whether or not he could incite the Nets to force even more turnovers because his most disruptive days were in Miami and its aggressive pick & roll defense. Because I tracked his initial Miami year and his return year to Cleveland and got numbers around 13.4%, it’s reasonable to change the Nets turnover % differential from -2.5% through 23 games to around -1%. After using the natural log of the expression, the new value is 0.0198.
Roster Cont*Avg. Years = 1.472
If Lebron joins, the new numbers become:
Roster Cont. = 0.308
Avg. Years Exp = 4.78
where roster continuity = minutes retained from last year/total minutes
& averages years of exp. = total years experience of players who presumably play >= 18 MPG / # of players
Team 3P% = 36%
Here are all 3-point% from every season LeBron has played, ordered by 3P%:
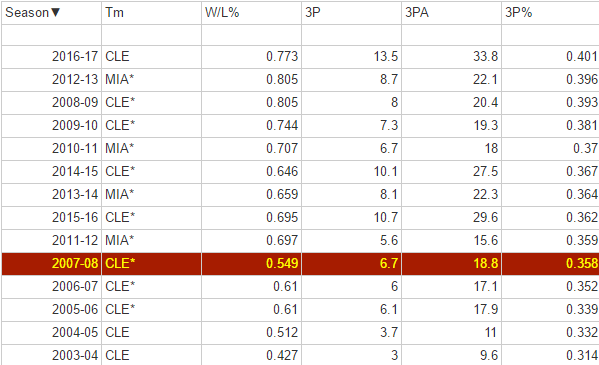
Brooklyn has a litany of eager 3-point shooters who could use the presence of an All-star would give them fewer contested shots and precision passes. This newfound space for release matched with Atkinson’s fondness of the corner three would allow willing 3-point shooters like Bojan Bogdanovic, Joe Harris, Justin Hamilton, Brook Lopez (!) and Randy Foye to thrive. I couldn’t see them doing much worse from 3-point land than the maligned Cleveland rosters that Lebron carried during the 2000s. No worse than 36%.
2+ All-Stars: No (0 value)
What if…
Lebron could make Brook’s game more appealing to the general public. If he became an All-Star caliber competitor with Lebron and changed this value from ‘no’ to ‘yes’, the model’s resulting win total would be even higher.
Team % of FGA from 16ft. to the 3 point line = .09
13.3% of Lebron’s FGA are of the long mid-range variety; Brooklyn’s team takes 6% of its FGA in this area, but LeBron’s game demands that he settle for these shots on occasion. Therefore, this number would increase a little. The 2016-17 Cavs are in the bottom five, in terms of long mid-range shots, and Atkinson seems to nearly eliminate such shots from his gameplan. It seems as if Brooklyn will remain among the bottom five in this category. Let’s estimate a value of .09.
Opp % within 3 feet of rim = 61%
When motivated, LeBron can probably guard 2-5 at this stage of his career. Since he’s returned to Cleveland, he has not enjoyed a Rudy Gobert-esque rim-protecting big man, and his team’s interior defense has struggled within 3 feet of the rim every year.
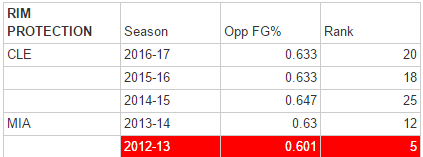
But the Nets are decent in this area. Lebron’s defense has not faltered (he’s +6.5 on/off defensive rating through 12/13). Their rim protection numbers may slightly improve, but it is tough to insist the numbers will significantly change.
Opp 3FG% = 36%
A Lebron-led defense has never been as awful as the Nets have been at limiting 3-point efficiency.
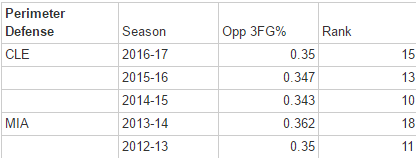
There’s a chance that the Nets’ 27th ranking is a byproduct of the strength of schedule and consistently overachieving opposing shooters, but it doesn’t appear as if the Nets have the bodies to contest shots extremely well. For players with 10 or more GP and 3 or more three-point contests per game, only Bogdanovic affects the opponent’s shot with consistency (diff% = -3.4%). Lebron closes out on shooters prolifically (diff% = -6.4%).
While Lebron may not be able to completely rectify this issue, he could bring the Nets back toward the mean — about 36% Opp. 3FG%.
Sum of Top 3 VORP (on pace for) = 12.8
Trevor Booker and Brook Lopez lead the team with .7 VORP each through 23 games.
Lebron could boost their individual contributions by making the game easier for them, but for the sake of simplicity, we’ll assume that they remain on the same pace that they’ve been on this season. To the sum of Brook+Booker VORP, we will add Lebron’s VORP and adjust this number for the model. As of 12/13, the Nets and Cavs have played 23 games and 21 games, respectively.
Total VORP = .7*82/23 + .7*82/23 + 2*82/21 = 12.8
Team Assists per 100 possessions = 17%
Lebron passes the ball 57 times per game and receives another 69 passes per game. Because he is the centerpiece of the offense, he’ll generally dictate the flow of his offense. He’s got a 43.5% Assist rate, and his teams have almost always been in the top third of the league in this category for the past 5 years.
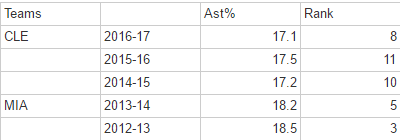
An approximate Ast% of 17 assists per 100 possessions would put them into the top third of the league.
So, let’s recalculate LeBrooklyn’s winning percentage according to the regression model.
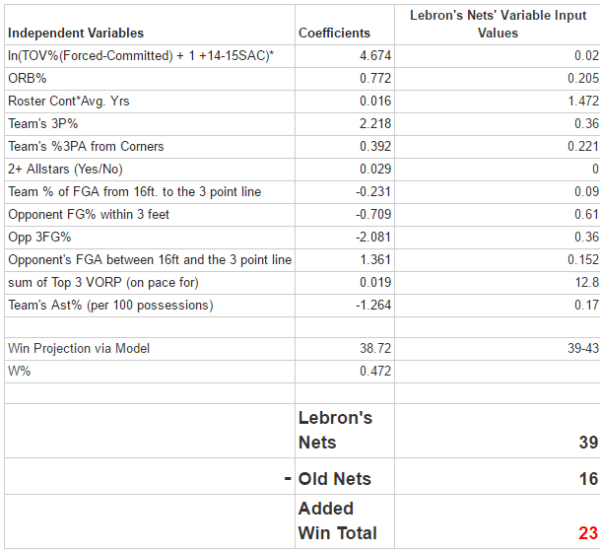
In review, Twitter is really smart (sometimes). The prediction and statistical model both suggest that Lebron adds 20-25 wins to the worst team in the NBA. This is why GMs still choose a 32-year-old Small Forward to be the face of their franchise, if available.
A lineup of Jeremy Lin, Bojan Bogdanovic, Rondae Hollis-Jefferson, LeBron and Brook Lopez could even be a playoff team which is truly a testament to the most gifted player on the planet.
And from there, who knows whether or not LeBrooklyn could advance against another playoff team. It would certainly be quite the sight.