Using statistical modeling tools to form sound measurements for player and team comparison is becoming increasingly prevalent, and rightfully so. The use of predictive analytics and regression analysis has given insight on the effectiveness (or lack thereof) of certain players, specifically when used in combination with sound inference-making rooted in basketball knowledge.
My desire is to create a new metric that, if refined, can add to our evaluation process. Of course, it’s not nearly perfect in its inaugural stage.
This regression model was made specifically for the action of the 2016-17 NBA season. I’ve yet to use the appropriate historical databases that would give this model extra observations, improve its clarity, and decrease the influence that each individual observation has on the model. That will come once I have greater access.
Note: I only included players with 249+ minutes played during this season.
Methodology and Variables
Let’s discuss the factors & red flags that arise when attempting to trust the model’s results.
Dependent Variable: “Amplified Net Rating”
Histogram of Amplified Net Rating’s distribution


- It’s exceedingly difficult to separate the impact of each player from team metrics. After all, the results of each possession are contingent upon the movements and actions of all 10 players.
- Although net rating can be a little deceptive at times, whether your team is outscoring the other is ultimately important. Therefore, the offensive efficiency & defensive efficiency results are crucial. We understand that although noise can exist (for example, Kawhi Leonard’s unscrupulously high defensive rating due to inflation from an inordinate amount of coincidence, according to Bo Schwartz Madsen of Nylon Calculus), but a player with a -15 net rating will likely have noticeable flaws. Ridge Regressed Amplified Net Rating ( a statistic that we’ll track) indicates that players with higher values are generally conducive to better team net ratings.
- I believed it was fair to assume that most impactful starters will play about 36 minutes. From there, I adjusted the net ratings. Therefore, the effect of a player who is on the court for longer than 36 MPG is amplified (whether that be positively, or negatively, is up to them), and the effect of a player who is featured for fewer than 36 MPG is diminished– greatly diminished for players who are merely rotation players.
- Next time, I’ll probably attempt to add team adjustments in order to avoid unnecessarily penalization of bad rosters.
Independent Variables
Many of these metrics/factors for the testing of Amplified Net Rating are shared among different metrics like RPM, BPM, Dredge, but there are several unique ones that I added, in hopes that we’d see them interact with the final model. All factors have been ridge regressed so that we could be confident in the constants’ stability.
MPG: 0.04
- Ideally, players who play more minutes are rewarded for their efforts. Generally, coaches intend to play the athletes that give a more positive impact– unless they’re tanking, I suppose.
(TS% – Position Avg. TS%): 79.83
- The better a player shoots, the more efficient an offense can become. My thought process behind comparing it to the nominal position avg. was to prevent direct comparisons between the true shooting percentages of volume scorers and centers who qualify as athletic rim runners as those players are more prone to excel by taking shots with expected success and without excessive shot contests/interference.
(3PAr – Position Avg. 3PAr): 2.991
- Essentially, increasing 3PAr would suggest that players are shooting more shots that have higher expected return which can foster better offensive efficiency. Of course, a player could have a 100% 3PAr with a large sample size, but an NBA player who gets significant minutes is not likely to take an exorbitant amount of three point shots without being reasonably open. (I could’ve tried an interaction with USG%, and may actually do so in the next issue of this)
FTr: 4.072
- Always preferable to get to the line to convert uncontested free throw attempts.
ORB%: 44.7
- Every model for basketball analytics includes offensive rebounding because providing extra possessions can be crucial to success. Also, the defense is not always set after offensive rebounds, so easy shots on putbacks and 3-pointers might exist.
Assist Points Created Per Minute: 5.943
- I chose not to use AST%, which BPM does, because I attempted to use “Impact Passes Per Minute” to help complement APCPM which contained hockey assists but didn’t test as a significant independent variable.
Havoc Coefficient: 2.386
- I used this coefficient in place of STL% to signify the hustle and defensive attentiveness with which a player plays (maybe even his lateral quickness, perhaps, but not necessarily). The Havoc Coefficient is derived from this quick formula: Havoc/Min = [Deflections + 2*(Loose Balls Recovered + Charges Drawn)] / Minutes Played.
- Players who get the deflections that lead to the recovery and change of possession are rewarded with the steal stat. I like this convention, but when using deflections & recoveries from NBA.com, I determined that recoveries are slightly more valuable because it’s preferable to possess the ball in the aftermath than to deflect the ball out of bounds. From there, player X’s Havoc Coefficient = (Havoc Per Minute of X) / (maximum individual Havoc Per Min)
- A player’s havoc coefficient is relative to all qualifying players. A higher coefficient should lead positively to a greater team result in the long run. Active hands on defense are always encouraged.
BLK%*Contested 2-Point Attempts Per Minute: 122.978
- This seemed to have a fairly strong impact on the model. Blocks are great, but frequent contests/shot alterations will provide long-term success; therefore, I chose to use an interaction of the two terms.
Contested 3-Point Attempts Per Minute: -21.03
- Quite an interesting result, but it’s possible that this coefficient would provide more clarity with more than a year’s worth of observations. However, we know that 3-point FG% defense does not seem to correlate from year n to year n+1. The best defense of 3-point attempts is to limit the volume altogether. So the model could really be onto something after all.
Defensive “Lapses” Per Minute: -110.75
- Lapses aren’t quite easily calculable. The numerous times that players like Russell Westbrook may have unnecessarily tagged the roll man without recovering to his primary defensive responsibility are not recorded by the data from NBAminer.com. So instead, defensive lapses per minute originate from the frequency of defensive 3-second violations & defensive goaltends. Quite honestly, I was surprised that this made it as a statistically significant variable.
DREB% * (1 – Defensive Lapses Per Minute): 17.91
- Essentially created to further reward players who end opposing offensive possessions without making frequent mistakes.
USG% * Ugly Turnover Rate: -11.66
- I chose to include data from NBAminer such as bad pass frequency and lost ball turnover frequency and compound it with a player’s usage rate. Therefore, lowly-utilized players who experience the same rate of ugly turnovers as those with overwhelming usage rates aren’t as heavily penalized.
USG% * Out of Control Turnover Rate: -16.94
- An Out-Of-Control turnover is accounted for by compiling the frequency of out-of-bounds turnovers and traveling violations.
Sadly, the emotional volatility rate (EVR), below, didn’t make the cut! It’d have been quite nice to see whether or not emotional outbursts (or at least the ones that are judged unlawful) impact the player’s potential impact on net rating positively or negatively.
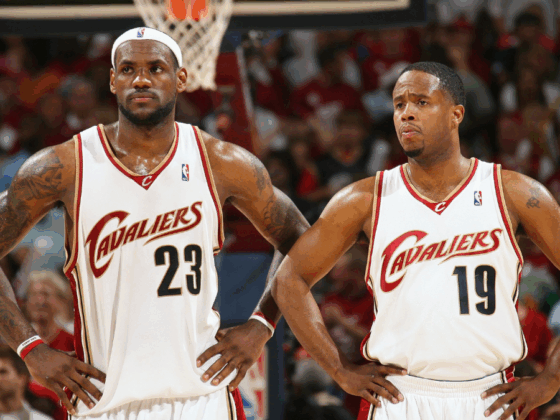
When constructing Dredge, Justin Willard used “techs & flagrants” as one of his independent variables, citing that it can have a positive impact of a player’s aptitude. And in the chart above, it appears as if the most volatile players all have relevant playoff experience. At the very least, we could say that frequency of techs/flagrants weakly, positively correlates with player ability.
Awesome… let’s check in on our responses. How well did this model perform?
Raw Results
First, I wanted to track the distribution of the Ridge Regressed Amplified Net Rating responses for all qualifying players.
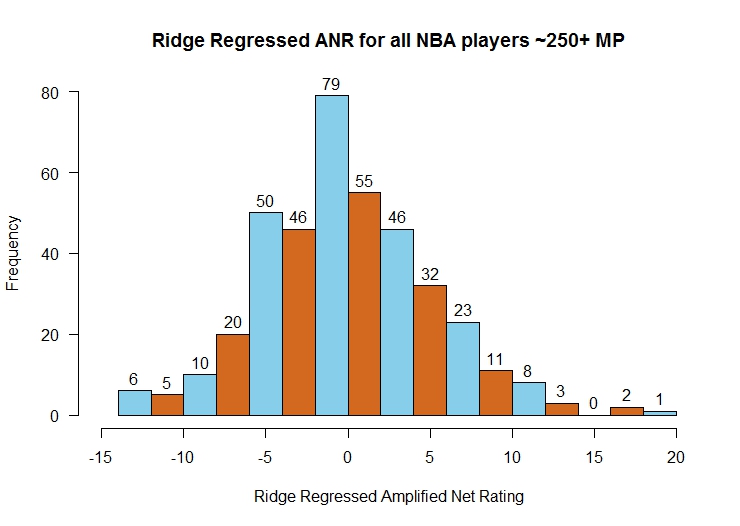
- The distribution is normal, which is preferable, but how are players from each position represented?
- Are they represented equally?
These next two histograms feature the mean values for each nominal position’s ridge regressed amplified net rating. Centers have a distinct advantage.

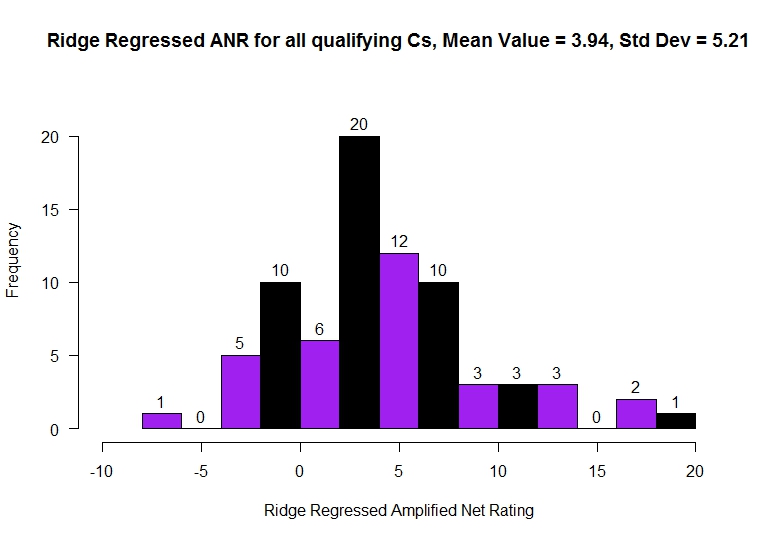
Could this favoritism stem from rebounding percentage? Perhaps.
True Shooting%? It seems likely as well.
Nevertheless, using raw RRANR to compare a player like Salah Mejri to Kyle Lowry, knowing the unequal means, would be disingenuous.
Positional Z-Scores while maintaining the integrity of RRANR
Using Z-Scores for each position means that the players’ RRANR totals will be judged relative to the mean and standard deviation of the positional data. This slightly impairs the cross-positional freedom that we desire when creating ranking and analytical player metrics.
However, using Basketball Reference which records to the frequency with which a player was featured at each position (PG through Center) during the year, I feel confident with using nominal positions.
By calculating each player’s positional Z-Score, we can assess how proficient they are relative to other guards/forwards/centers, and then compare the Positional Z-Scores to one another as an additional metric, ZRRANR – Z-Scores of Ridge Regressed Amplified Net Rating. Check the new rankings, given the positional z-scores. Also, take a look at how each individual ranks with respect to the position he most often plays.
So we aren’t sacrificing the idea that RRANR should indicate the players’ aptitude and ability to sustain quality offense and/or defense.
Questions & Takeaways
- Q: Why are some players who are usually relegated to small minutes allocations given such impressive RRANR and Z-Score results?
- A: We should consider how some reserves get minutes against other reserve lineups, don’t face stiff competition and therefore have favorable net ratings. The potential RRANR and Z-Score are only diminished so much by their low minute count.
- Adding more observations and adjusting the true amplified net rating (in the observation pool) would go a long way to limiting highly influential observations and representing how much a player adds to his team.